We help you to understand the data, or visualise in a way that help you making business decision.


Why Data cleaning and visualization required?
Data comes from various source and in different times, sometimes the title or label becomes different, but the same type of data, sometime the format becomes different, sometimes relationships change among objects and data, or some additional property or attribute added to data format, these all happens because of different practice and/or by different people.
But that’s how business works, we are human, we are different!
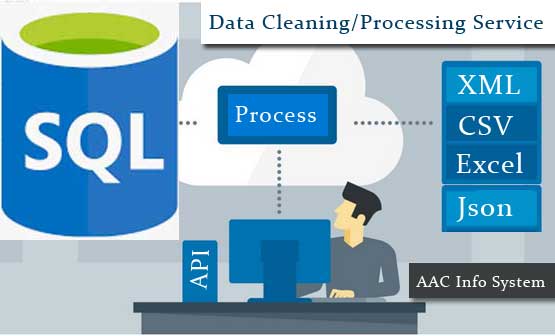
You may work with different data source like excel, csv, json, different database in local or cloud, may need data processing service on regular basis to support your business growth!
Organised data always help any business owner to think better, and with more clarity!
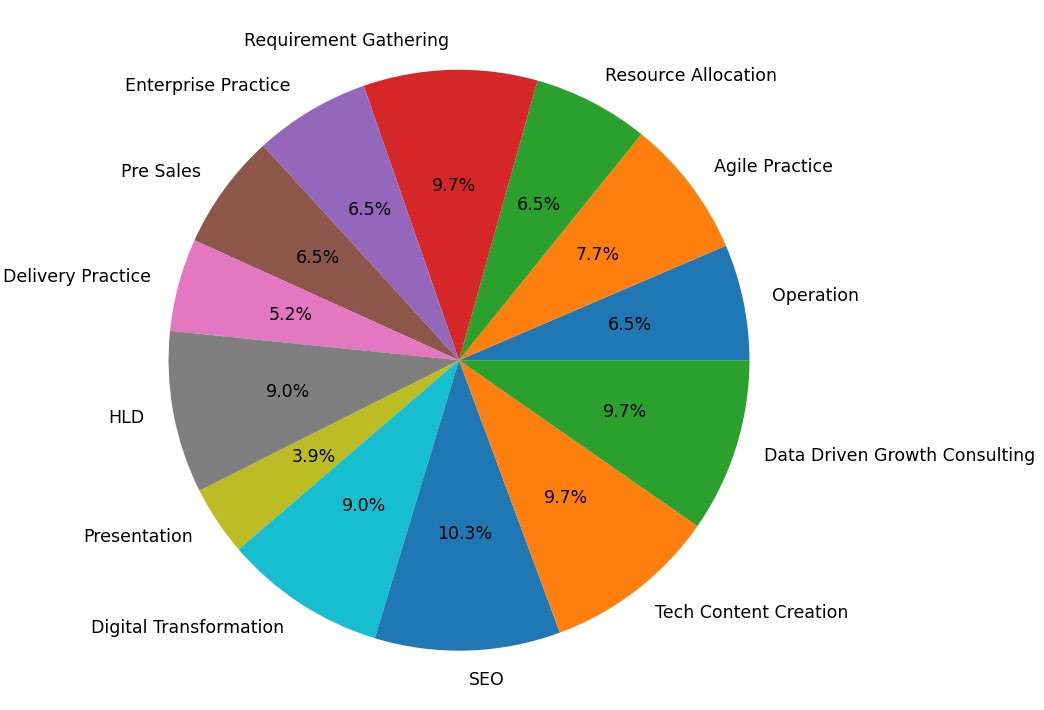
First, we have to clean the data, and make one data view, then we can visualize like this!


When it comes to understanding the current business scenario, it becomes a big task, to organise data, and put them together to make some business sense for present situation!
There are many tools for data visualization, Power BI desktop is one of the popular tools, but python matplotlib is widely used library for visualization, even power bi allow to run this python library within the desktop tool.
Sometimes for large amount of data processing with complex business logic, many organization prefers SSIS, well maintainable and standard tool.
If there is any midterm (above 6 months long) projects, which needs ETL support, we can setup SSIS (we don’t do regularly).
You may also check